Outline of the Pandas Chapter |
|
Introduction
Pandas describes the basic similarities of organisms at the cellular and biochemical level.
The Structures Of Molecules
Pandas fails to point out that many different amino acid sequences will produce the same three-dimensional folding pattern (Lau and Dill, 1990) as will be demonstrated with the cytochrome c enzyme. Also, the "remarkable" feature that proteins in living cells all contain only left-handed amino acids, probably results from the fact enzymes (organic catalysts) are involved in protein production and enzymes are very sensitive to the three-dimensional shape of their substrates. The same can be said for the right-handedness of the sugars in nucleic acids.
Common Pathways, Common Code
Here Pandas does point out that all eukaryotic organisms have the same complex molecular machinery (of which cytochrome c is a part) in their mitochondria. There are, however, known variations of certain pathways in various organisms. Anaerobic metabolism in yeast, for example, produces ethyl alcohol instead of lactic acid. Also different compounds may be used for similar functions in various organisms. For instance, a variety of respiratory pigments, which increase the oxygen carrying capacity of blood, are found in animals. They include the familiar haemoglobin, the green iron pigment chlorocruorin found in several families of polychaete worms, the violet/pink iron pigment haemoerythrin found in some sipunculids, polychaetes, priapulids and brachiopods and the blue copper pigment haemocyanin found in some crustaceans, the horseshoe crab and molluscs (Brusca and Brusca, 1990). In general, modern research shows that the Protoctista (Protista) exhibit so much biochemical diversity that nearly 20 kingdoms(!) ought to be created to accommodate them (Margulis and Schwartz, 1982). Even greater biochemical diversity exists among the Prokaryotes. The viruses exhibit every conceivable variation on nucleic acid structure in their hereditary material (Joklik, 1974). There are even variations in the genetic code found in mitochondrial DNA (Jukes, 1983). (Actually, uniformity of the genetic code is a weak argument for a designer. Most computer manufacturers use what is called the ASCII code for representing information in their computers, yet IBM uses an entirely different and incompatible code (EBCDIC) for the same purpose.)
The Meaning Of Homology On The Cellular Level
Design proponents attempt to explain biochemical similarities as a requirement for efficient functioning of the food chain. The designer must have forgotten this requirement when it forgot to endow most of its herbivorous designs with an enzyme to digest cellulose and lignin, making herbivore digestion very inefficient and complicated. But why have a food chain? There is nothing comparable among human design products. And you can have a viable ecosystem with just microorganisms. Multicellular animals and plants are superfluous. The adaptations of predators and prey are like an arms race among weapons manufacturers. But the designers of a counter-weapon are not the same designers that designed the weapon. They usually work for a different company and a different nation. By analogy, it would follow that there are different designers for predator and prey organisms. There is obviously an intense rivalry among these biological designers, given the fantastic array of predators and parasites and the strategies, bordering on the fiendish and diabolical, that they use to catch and eat their prey! More than half the known species of animals are parasites on other living animals (Price, 1977). Some of these design rivalries are bizarre. Even Darwin couldn't imagine an intelligent designer designing tens of thousands of species of insect parasitoids, that eat their living hosts from the inside.
The metabolic pathways in organisms are long with many involved steps and unexpected complexity. Even the process of blood coagulation involves a labyrinthine series of about 10 steps, resembling more closely a biochemical Rube Goldberg apparatus than an intelligent, rationally designed mechanism. These pathways are more consistent with the operation of a tinkerer, rather than the intelligent design of an engineer. And natural selection can only operate as a tinkerer, modifying entities that already exist (Jacob, 1977).
Similarities In Molecular Sequences
As Pandas correctly states, similarities in molecular sequences, whether they be sequences of nucleotides in DNA or amino acids in proteins, provide a large array of new characters which can provide homologies expressed quantitatively. These homologies can then be used to erect classifications of organisms.
Family Trees
Pandas immediately tries to discredit the use of molecular sequences, claiming that the computer programs construct evolutionary trees by "massaging" the data (whatever that means) with evolutionary theory. Even then such programs generate a number of different trees consistent with the same data. Evolutionists then "choose" the "best" tree to be presented as the final result (see Pandas' Figure 6-3). How true are these allegations?
How Molecular Sequences Are Compared
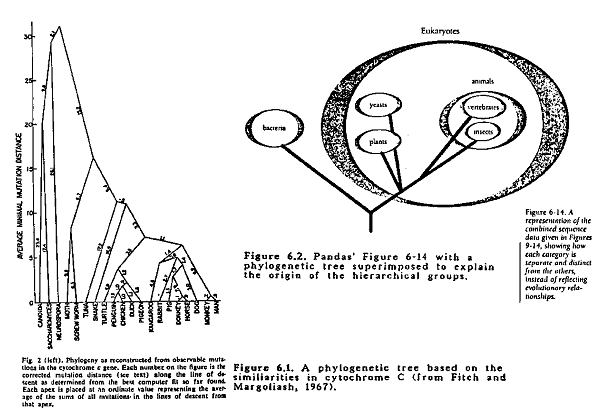
Fitch and Margoliash (1967) generated an evolutionary tree using data on cytochrome c sequences from 20 different organisms representing a wide range of groups. The tree is presented here as Figure 6.1. The 20 organisms are almost the same as the 25 presented in Pandas' Figure 6-6 (p. 141) and the 19 in their Table 6-1 (p. 142). The main objective of the paper was to present the method of constructing the tree. The method involves the following steps:
- The mutation distance between every pair of cytochromes is calculated. This is the minimal number of nucleotides that would need to be altered in order for the gene of one cytochrome to code for the other. These numbers are similar but not identical to the percent divergence figures presented in Pandas' Figure 6-6.
- The computer program works with the mutation distances as the basic input data. It then follows a set of rules to group the cytochromes into a set of nested groups according to their mutation distances, forming essentially a hierarchic classification according to the degree of homology of the various cytochromes. Although the results are displayed in the form of a phylogenetic tree, no evolutionary theory is involved. The program uses the cytochrome homologies in the same manner as the 19th century pre-evolutionary biologists used anatomical homologies to generate their classifications. (See Dayhoff, 1969 for a more detailed description of the process.)
- Due to the nature of the program one can, by using a different starting points, generate a number of different trees. The researchers in fact constructed 40 such trees. They were all very similar, differing mainly in the details of how the birds and mammals were grouped.
- In constructing the larger groupings, the average mutation distances of the smaller subgroups were used. As a result, summing distances over the tree to get the total mutation distance between any two organisms will not yield exactly the same value as the original input mutation distance. To select the "best" tree, the researchers used a purely statistical criterion. A percent "standard deviation" was defined which represented the degree to which the mutation distances calculated from a tree agreed with the original input data. The best tree (presented in here in Figure 6.1) is the tree with the smallest percent "standard deviation." Clearly the choice of best tree involves no evolutionary theory.^ML=-.50
Thus Pandas' Figure 6-3 is incorrect. The data are not "massaged" with evolutionary theory and the "correct" trees are not chosen on the basis of other data. As Fitch and Margoliash point out (middle of column 3 on p. 283 of their paper), the method makes no assumptions about the rate at which mutations have accumulated, that is, no assumptions about a molecular clock are involved. The same is true of Farris' distance-Wagner method (Farris, 1972).
This tree "is remarkably like that constructed in accord with classical zoological comparisons" (Fitch and Margoliash, 1967). Again, it is not based on evolutionary theory. If protein sequencing data and computers were available to the early 19th century biologists, they might have used the very same technique, although the results would have been presented as a hierarchical classification, rather than as an evolutionary tree. Farris (1972) discusses the variety of methods used to construct phylogenetic (evolutionary) trees from biochemical distance matrices. Most of these are based on numerical taxonomy techniques and phenetic similarities which are independent of evolution (Fitch and Margoliash, 1970). Although many of the methods generate "ancestral nodes" (branching points on a tree), Owen would say they represented "Types." Penny et al (1982) present a technique, using graph theory, that could even refute the existence of an evolutionary tree. Avers (1989, p. 347 fol.) gives a good introduction to the methods of constructing trees.
The Search For Intermediate Sequences
Pandas notes that the cytochrome divergence patterns resemble that depicted by traditional taxonomy. Pandas further says (p. 142) that this is what one would expect on the basis of the evolutionary viewpoints and would be a striking confirmation at the molecular level of Darwinian evolution! It is at this point that Pandas introduces the utterly unjustified and nonsensical concept of evolutionary sequence of living forms in a desperate attempt to discredit this evidence for evolution.
Pandas puts these living forms (which are at the tips of the tree shown in Figure 6.1) into a straight line sequence (shown in their Table 6-1) and claims that the molecular patterns do not follow a pattern of intermediate sequences, but instead a pattern as shown in their Figures 6-9 through 6-14 and hence the data refute evolution!
Of course the straight-line evolutionary "sequence" shown in their Table 6-1 is nonsense. No evolutionist ever suggested that the Rhesus monkey evolved from the Rabbit, the Horse from the Chicken, the Chicken from the Turtle, the Tuna from the Screw Worm, the Silkworm from the Sesame plant or Mung Beans from Yeast, to mention only a few of the inanities embodied in this table. Evolutionary relationships follow a branching pattern (as in all evolutionary trees), not a straight line sequence).
All the life forms considered in the cytochrome c database are present-day living forms hence none are more primitive' or transitional stages' between others. They are all on the tips of the twigs of an evolutionary tree. The only forms that are truly transitional and would make a true evolutionary series' would be forms that lived in the past and exist now only as fossils. The bullfrog (Pandas' Figure 6-11) is a highly advanced and specialized amphibian. The amphibians that were actual transition forms between fishes and reptiles existed in the late Paleozoic Era. Any intermediate cytochrome sequences would have to come from these actual ancestral forms which, unfortunately, only exist as fossils (Pandas actually mentions this on p. 149!).
The Data Fit A Pattern
The patterns depicted in Pandas' Figures 6-9 through 6-14. correspond to the common branching points on the tree shown in Figure 6.1. This is clearly shown in Figure 6.2 where an evolutionary tree is superimposed over Pandas' Figure 6-14. This has been pointed out repeated by evolutionists as the fundamental error committed by Michael Denton in his book: Evolution: A Theory in Crisis from which Pandas' Chapter 6 has been taken (Landau, 1989; Scott, 1990; Schadewald, 1990; Sonleitner, 1990; Thwaites, 1989). Thus Pandas' biochemical argument against evolution is totally without any logical or biological foundation. One wonders how Denton and the creationists (sorry, design proponents), which include at least one with biochemistry training, could have committed such a gross error. It says little for their intelligence and/or veracity. Or their consistency on p. 142, the similarity of the cytochrome c pattern to the traditional taxonomic arrangement is said to be a striking confirmation of evolution; on p. 146-147 this same pattern is said to totally refute evolution! In spite of the total invalidity of this argument, it has been presented with glee(!) in many creationist publications (ex: Pearcey, 1989).
Pandas shows a similar pattern derived from hemoglobin in their Figure 6-15 showing an equal amount of divergence of a number of animals from the snail and claims: "This fact would not have been predicted by any informed scientist with an evolutionary frame of reference." That claim could not be more wrong! Pandas further claims that these data "show how false is the notion that advances in molecular biology are continually confirming evolutionary theory." In the following sections I will show that the molecular data are a brilliant confirmation of evolution but also that, contrary to Pandas, intelligent design (creationism) cannot explain these data!
Why Are The Cytochrome C Sequences Different?
Cytochrome c performs the same function in all organisms. It is found in the mitochondria (except in the prokaryotic bacteria) and is a part of the electron transport system which functions in aerobic respiration. Cytochrome c accepts electrons from a complex built into the mitochondrial membrane called cytochrome reductase and gives up the electrons to another complex, cytochrome oxidase (Dickerson, 1980). It consists of a chain of 104 amino acids folded into a three-dimensional structure bound to a heme group. Although there are differences in the sequence of amino acids in the various organisms (see Dayhoff, 1969; Dickerson, 1972; Dickerson, 1980 for the actual sequences), all versions have the same three-dimensional shape, even the cytochrome c from humans and Neurospora which differ in 44 of the 104 positions. To further illustrate the functional equivalence of all these versions of cytochrome c, the cytochrome c from any organism reacts equally well in the test tube with the cytochrome oxidase from any other species (Dickerson, 1972).
Knowing the amino acid sequences and the three-dimensional configuration, we can understand fairly well the chemical role that each amino acid plays in forming the functional cytochrome c molecule (Dickerson, 1972). Amino acids differ in the chemical nature of their side chains. It is these that determine the role that an amino acid plays in the structure and functioning of the polypeptide. For example, the chain is folded so that oily hydrophobic side chains are on the inside and polar, hydrophilic side chains are on the outside. The positions of such amino acids in the chain is critical; they help make the chain fold properly. Any substitutions of these amino acids are always with amino acids with similar side chains. Many of the amino acids involved in the attachment to the heme group are invariant. On the outside of the molecule is a pattern of positive and negative regions that possibly play a role in the interaction with the cytochrome reductase and cytochrome oxidase complexes. Changes here always involve amino acids with similar charges. There are only a few positions where a wide range of amino acids may be found. Thus all the changes seen in the amino acid sequence are selectively neutral. They do not change the functioning of the molecule.
Cytochrome c then is an example of the neutral theory of molecular evolution (Kimura, 1979; Jukes, 1988; Gould, 1985). When mutant genes that are selectively neutral appear in a population, their frequency fluctuates at random. In time most of them disappear, but occasionally some of them spread through the population and become fixed with a frequency of 100 percent. During the course of time, such neutral mutations will accumulate in the population. Over long periods of time, the rate of accumulation will average out to a relatively constant value.
The Molecular Clock Hypothesis
The above considerations are the basis for the idea of a molecular clock. The distance similarities shown in Pandas' Figures 6-9 to 6-13 support the idea that differences in the cytochrome c chain have accumulated at a steady rate (as Pandas admits on p. 147). Figure 6.3 (from Dickerson, 1972) plots the average difference in amino acid sequence between organisms on two sides of an evolutionary branch point, say, between reptiles and mammals (vertical axis) versus the time elapsed since the divergence occurred as determined by the geological record. This is done for four difference proteins. In each case the points fall close to a straight line, indicating a constant average rate of evolutionary change. Note that we are dealing with similar average rates on different branches of an evolutionary tree, not some deterministically fixed mutation rate as Pandas implies (p. 147).
Multiple Molecular Clocks
Why do the different proteins in Figure 6.3 have different rates of change? These are not mutation rates per se but rates of fixation of neutral or harmless mutations. Our knowledge of the chemical structure and function of fibrinopeptides shows that they can tolerate many random changes, that is, a large proportion of the mutations will be neutral. A hemoglobin molecule has many more constraints and random mutations are five times more likely to be harmful than in fibrinopeptides, hence the rate of accumulation of harmless mutations is five times slower in hemoglobin. (For more information on the evolution of hemoglobin, see Perutz, 1964 and Zuckerlandl, 1965). A large fraction of the surface of cytochrome c is involved in interacting with the reductase and oxidase complexes; hence a much smaller proportion of mutations in cytochrome c are harmless and its observed rate of change is concomitantly slower. Since histone IV (a basic protein that binds DNA to the chromosome) changes very slowly, apparently very few random changes in its structure are tolerated (Dickerson, 1972).
  |
When one realizes that the molecular clock concerns the rate of fixation of neutral or harmless mutations, Pandas' criticisms based on mutation rates and the existence of multiple molecular clocks can be seen to be irrelevant. And evolutionary changes that are the result of nonneutral mutations subject to natural selection will not occur at constant rates. There are problems with estimating molecular clock rates and testing the constancy of such clocks (see Scherer, 1990) but the evolutionary interpretation of sequence data is based on the neutral gene hypothesis and not on the related idea of a molecular clock.
How Do Intelligent Design Proponents (Creationists) Explain The Data?
Regardless of how well the molecular clock may keep time, if the differences in cytochrome c are due to accumulation of random, neutral mutations, then the similarities that say, all vertebrates share relative to insects, plants and bacteria, can only be explained by common ancestry! That makes these data direct evidence for evolution and not just another criterion for classifying organisms. A specific prediction of the evolutionary hypothesis is that "evolutionary trees" of the same organisms constructed from different protein sequences should be the same. The prediction has been upheld by the work of Penny et al (1982) using sequence data for 5 proteins from 11 species.
Similar evidence for common ancestry is provided by pseudogenes. These are copies of genes that have become nonfunctional as a result of mutations. Any subsequent mutations in such a gene are neutral as far as the organism is concerned and will neither be selected for or against. The finding of identical pseudogenes in different organisms is strong evidence for their common ancestry because the alternative, that each line suffered the same series of identical random mutations, is highly improbable (Max, 1986; Li, 1983).
Pandas' claims that the data from biochemistry shows that living things cluster around a basic pattern or type for each class of organism, without any intermediates from one type to another as shown in their Figure 6-14. We have shown how evolution explains that pattern, which is based exclusively on modern living organisms in our Figure 6.2. Why should this be the state of affairs if an intelligent designer or designers created organisms? Remember that the biochemical data show that cytochrome c is an enzyme performing an identical function in all the organisms considered and it does it under virtually identical chemical conditions in the mitochondria of all those forms (except, of course, the bacteria.) Thus if all these forms were created a short time ago by an intelligent, rational creator, cytochrome c should have an identical structure in all these forms! After all, it is almost an ideal example of one of a "small vocabulary of forms . . . limited by functional constraints" (p. 133), "discrete blocks" or "pre-assembled units" (p. 33) or "common means .. . to achieve similar functions" (p. 137) evoked by Pandas in a pitiful attempt to explain similarities. But it doesn't have an identical structure! As a consequence, it simply doesn't fit in with Pandas' conception of homology at the cellular level. Why is this enzyme different in the various classes?
Design proponents (creationists) can't explain these data! Even if they fall back upon a molecular clock model (the clock running about a million times faster than the evolutionists postulate), the expected results would be different. Since all these forms would be equidistant in time from their creation, they all should be equally different from one another (say 65% different). Thus the creationist is almost forced to assume that these differences in cytochrome c structure are somehow adaptive (functionally significant) in the various forms. But, as I have shown, all the biochemical evidence points to the fact that observed differences in structure are neutral and have no effect on the function of cytochrome C. (That, in fact, is what makes the molecular clock plausible.) They would also have to explain why different proteins give the same evolutionary trees as shown to be the case by Penny et al (1982). Thus, unless creationists fall back upon some form of theistic evolution, the results of protein sequencing provide some of the most significant evidence against intelligent design (creationism)!
Conclusion
All the "conclusions" of Pandas are false or irrelevant. Pandas "proves" that spontaneous generation is impossible, then claims that it occurred frequently throughout geological time (as instantaneous miraculous productions of new forms by designers). Biological organisms might exhibit some characteristics of manufactured things, but in basic ways they are fundamentally different. Changes are limited in experimental breeds because of the slowness of natural production of mutations. Increasing the mutation rate by radiation exposure makes further change possible. The fossil record does provide intermediate forms connecting the taxonomic groups. The patterns of similarity among organisms do not show what one would expect from common design by a single designer. And the molecular data, grossly misinterpreted by Pandas, do corroborate evolution and refute intelligent design! Furthermore molecular biology has shown that the hereditary material is full of extraneous copies, nonfunctional pseudogenes and other non-coding garbage, hardly the kind of "blueprint" that an intelligent designer would create. Throughout this critique, we have seen that "intelligent design" (creationism) is empty of explanatory power. The real phenomena do not even fit its alleged predictions.
References:
Avers, C. J. 1989. Process and Pattern in Evolution. Oxford University Press.
Brusca, R. C. and G. J. Brusca. 1990. Invertebrates. Sinauer Associates, Inc.
Dayhoff, M. O. 1969. Computer Analysis of Protein Evolution. Scientific American 221(1): 86-95.
Dickerson, R. E. 1972. The Structure and History of an Ancient Protein. Scientific American 226(4): 58-72
Dickerson, R. E. 1980. Cytochrome c and the Evolution of Energy Metabolism. Scientific American 242(3): 136-153.
Farris, J. S. 1972. Estimating phylogenetic trees from distance matrices. American Naturalist 106: 645-668
Fitch, W. M. and E. Margoliash. 1967. Construction of Phylogenetic Trees. Science 155: 279-284.
Fitch, W. M. and E. Margoliash. 1970. The Usefulness of Amino Acid and Nucleotide Sequences in Evolutionary Studies. Evolutionary Biology 4: 67-110.
Gould, S. J. 1985. A Clock of Evolution. Natural History (Apr.): 12-25.
Jacob, F. 1977. Evolution and Tinkering. Science 196: 1161-1166.
Joklik, W. K. 1974. Evolution in Viruses. In: Carlile, M. J. and J. J. Skehel (Editors). Evolution in the Microbial World. Cambridge University Press.
Jukes, T. H. 1983. Evolution of the amino acid code. In: Nei, M. and R. K. Koehn (Editors). Evolution of Genes and Proteins. Sinauer Associates Inc. pp. 191-207.
Jukes, T. H. 1988. Molecular Evolution and Ancestry of Living Organisms. Creation/Evolution Newsletter 8(4): 5-7.
Kimura, M. 1979. The Neutral Theory of Molecular Evolution. Scientific American 241(5): 98-126.
Landau, M. 1989. Protein Sequences and Denton's Error. Creation/Evolution 9(2): 1-7.
Lau, K. F. and K. A. Dill. 1990. Theory for Protein Mutability and Biogenesis. Proceedings of the National Academy of Science USA 87: 638-642.
Li, W-H. 1983. Evolution of Duplicate Genes and Pseudogenes. In: Nei, M. and R. K. Koehn (Editors). Evolution of Genes and Proteins. Sinauer Associates Inc. pp. 14-37.
Margulis, L. and K. V. Schwartz. 1982. Five Kingdoms: An Illustrated Guide to the Phyla of Life on Earth. W. H. Freeman and Company.
Max, E. E. 1986. Plagiarized Errors and Molecular Genetics: Another Argument in the Evolution-Creation Controversy. Creation/Evolution 6(3): 34-46. (Issue XIX, Winter).
Pearcey, N. 1989. Echo of Evolution? The Revolution in Molecular Biology. Bible-Science Newsletter 27(12): 7-10.
Penny, D., R. Foulds and M. D. Hendy. 1982. Testing the theory of evolution by comparing phylogenetic trees constructed from five different protein sequences. Nature 297: 197-200
Perutz, M. F. 1964. The Hemoglobin Molecule. Scientific American 211(5): 64-76.
Price, P. W. 1977. General Concepts on the Evolutionary Biology of Parasites. Evolution 31: 405-420.
Schadewald, R. 1990. Bliss on Molecular Biology. NCSE Reports 10(4): 17.
Scherer, S. 1990. The Protein Molecular Clock: Time for a Reevaluation. Evolutionary Biology 23: 83-106.
Scott, E. C. 1990. Of Pandas and People (review). NCSE Reports 10(1): 16-18.
Sonleitner, F. J. 1990. Molecular Nonsense in the Bible-Science Newsletter. NCSE Reports 10(2): 14-15.
Thwaites, W. M. 1989. Evolution: A Theory in Crisis (review). NCSE Reports 9(4): 14-16.
Zuckerlandl, E. 1965. The Evolution of Hemoglobin. Scientific American 212(5): 110-118.
(from Frank Sonleitner's critique of Of Pandas and People)