[S]tudents’ initial qualitative, common sense beliefs ... have a large effect on performance ... but conventional instruction induces only a small change in those beliefs ... the basic knowledge gain under conventional instruction is essentially independent of the instructor (Halloun and Hestenes 1998).
This statement summarizes the outcomes of numerous studies on student learning that suggest a change in teaching methodology is critical to achieving a greater degree of scientific literacy among our students (Hake 2000; Mintzes and others 1998; Udovic and others 2002). Although this statement is a recognition of the constructivist philosophy of learning, it also acknowledges a more specific problem relating to many basic scientific concepts. For biologists, the most notable among these are evolution and particularly natural selection. Students bring many naive beliefs about evolution to the classroom, which are particularly resistant to change through traditional instruction (Sundberg 1997).
The purpose of my ongoing research in biological education is to identify and describe teaching strategies that are effective against such entrenched beliefs and that will promote a more sophisticated understanding of basic concepts. In this paper, I summarize the results of my most successful interventions to address (1) major concepts related to evolutionary theory and (2) concepts related to the nature of science.
The Course
Most of the investigative exercises described below have been used in an independent college introductory biology laboratory course, paired with a traditional lecture, but the greatest student gains were observed when “lecture” and laboratory were integrated into a single course. Students were a mix of biology majors and non-majors. The course was scheduled for two 3-hour blocks per week. This intensive block format allowed for great flexibility in varying the time commitment to a variety of pedagogical techniques and particular concepts. Five readings were used in lieu of a textbook: Lives of a Cell (Thomas 1974), The Cartoon Guide to Genetics (Gonick and Wheelis 1991), Darwin for Beginners (Miller and van Loon 1982), Ever Since Darwin (Gould 1977), and Ecological Vignettes (Odom 1998). A variety of “majors’” textbooks was also available for use in class or for checkout for use as an encyclopedic reference as needed.
The primary instructional technique was a Socratic dialog based on daily readings. These discussions were also used to introduce specific problems for laboratory investigation. For instance, Darwin’s response to tropical diversity in the Amazon is used as a lead-in to the investigation on variation. The technique of concept mapping (Novak and Gowin 1984) is introduced early, primarily as a tool to identify questions for investigation. In a completed concept map, virtually every connector between concepts identifies a testable hypothesis. The class is divided into research teams the first day; these teams collaborate on investigations throughout the semester. Considerable peer instruction takes place during the performance of investigations and as results are reported to the class.
Controls for this study included traditional majors’ lecture and laboratory, traditional non-majors’ lecture and laboratory, traditional majors’ lecture and investigative laboratory, and traditional non-majors’ lecture and investigative laboratory.
The investigations dealing with evolution began with a passage from an 18th-century evolutionist’s theory of evolution (Lamarck 1809, in Ames and Siegelman 1966: 28–9). I purposely chose Lamarck as an entry into the theory of evolution because most beginning students who express any belief in evolution actually have a Lamarckian understanding of the process. This is a starting point to which students can relate but which ultimately leads to results that students must reject. In this passage, Lamarck contrasts his theory with the dogma of special creation. Students read the passage, underlining key words and phrases. As a class we then construct a concept map of Lamarck’s theory and identify possible points of testing. Figure 1 is a simple concept map of our current understanding, with the three concepts identified by Lamarck in boldface. These three concepts are the focus of investigation.
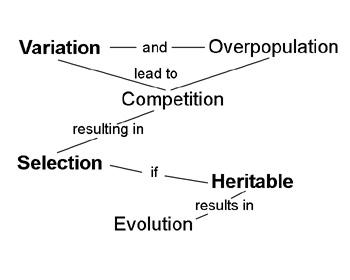 |
Figure 1. Concept map of evolutionary theory with concepts identified from Lamarck reading in boldface |
Variation
The null hypothesis, based on Lamarck’s text, is that species tend to be perfectly adapted to their particular circumstances, so there should be no significant variation among them in observable features. I present the research teams with a tin of either pecan fruits or sunflower seeds and challenge them to design an experiment to test the null hypothesis. Each team must formulate a research plan and have it approved before beginning the experiment. A variety of measuring instruments is available in the laboratory, including metric rulers, vernier calipers, graduated cylinders, and balances. (Students are familiar with each of these tools from their earlier investigation of accuracy and precision in measurement and basic descriptive statistics.) Typical parameters chosen for investigation include length, width (there are several sampling questions here such as where to measure, whether to choose maximum or minimum, and so on), mass, volume, and color pattern. Research teams must graph and interpret their data.
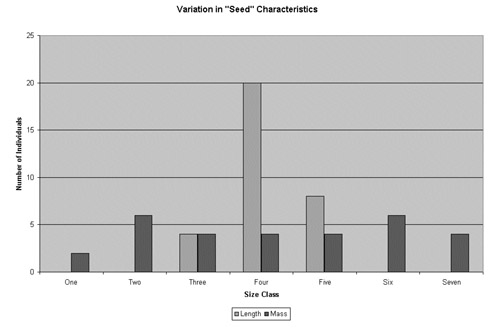 |
| Figure 2. Summary student data of variation in seed length and seed mass |
Figure 2 summarizes data from two student groups, one measuring seed length and the other seed mass. For comparison, the data are standardized into size classes. These data are representative of typical student results and were chosen to show two very different, yet common, patterns that students will discover. In both instances, evidence of variation in the chosen character is measurable and distinct. In the case of length, variation approximates a normal distribution, with the majority of individuals found in size class four. Similar distributions generally occur for width and volume. Seed mass exhibits more variability and in this case is almost evenly distributed among the size classes. Color pattern in sunflower seeds would be similar.
Several questions typically arise as individual research teams present and discuss their data. For instance, given the data discussed above, teams may question whether the observed variation is significant. Some may argue that the observed variation in length is so small as to be unimportant, and thus the data do not falsify Lamarck’s theory. This provides an opportunity for introducing the idea of a statistical test of an evolutionary hypothesis. Another common question concerns the presence or absence of what might seem a plausible correlation. In the above example, most students expect that longer seeds (or seeds of greater volume) would necessarily have greater mass. Here is evidence that what seems plausible is not always substantiated by data. Other unknown factors, in this case degree of hydration, may influence the data. These data can also be used to introduce the idea that the variation on which natural selection will work is random and does not arise to meet a specific need or purpose. Importantly, the variation investigation is simple and can be completed in one class period. A general characteristic of effective strategies for modifying ingrained misconceptions is that the tasks have simple manipulations and are of short duration (Sundberg and Moncada 1994).
Selection
Selection of existing characters is a key component of evolutionary theory; the testable null hypothesis is that the frequency of a specific trait in a population cannot be altered in subsequent generations by selection. For this investigation, we use two populations of fruit flies (Drosophila melanogaster) — wild-type “fliers” and vestigial-winged “crawlers”. After the class has had an opportunity to examine individuals of both populations, the research teams are divided into two groups. The teams in one group are challenged to test if the wild-type phenotype can be selected for; the other teams will attempt to select for the vestigial-winged phenotype. Although two or more teams are faced with the same challenge, each team must design its own experiment and have it approved before it can proceed. In the laboratory, I provide fly populations, flynap (used to anesthetize the flies), fly medium, and 2-liter plastic bottles. Each research team must provide any other additional materials it will need for its experiment. Typical materials include threads to suspend small containers of medium, straws, double-sided tape, flypaper, water moats, petroleum jelly, and external light sources.
Teams typically begin by introducing equal numbers of male and female flies of both phenotypes into their experimental and control chambers. (Most of the bottles can be hung in the room for decoration once they are set up.) During subsequent class periods, teams examine and take notes on the flies in their bottles. Although differential mortality can often be observed quite quickly, the experiments are allowed to run until the flies have produced at least their first generation of offspring.
Table 1
Sample Student Data for Fruit Fly Selection
| None (control) | For Fliers | For Crawlers | ||||
| Flier | Crawler | Flier | Crawler | Flier | Crawler | |
| Start | 10 | 10 | 10 | 10 | 10 | 10 |
| End | 158 | 38 | 245 | 78 | 81 | 23 |
| Caught in Flypaper | 62 | 4 | ||||
Table 1. Summary student data of selection for wild-type (flier) and vestigial-winged (crawler) fruit flies. |
||||||
Table 1 illustrates typical results, from which we draw several important conclusions. The wild-type group is usually pleased by its success in selecting for fliers; selection can alter the frequency of a trait in later generations. But when challenged, these students realize that a significant number of vestigial-winged flies also reproduced. Under these conditions, the fliers were more likely to survive and reproduce, but the selection pressure was not so intense as to prevent vestigial-winged flies from reproducing, too.
Selection for vestigial-winged flies is usually less successful. Invariably there will be more flier offspring (which were selected against) than crawler offspring (which were selected for). The obvious explanation for students is that these teams were not successful in designing traps or obstacles that could effectively keep fliers from reaching a food source while permitting crawlers to feed. But these results, along with the control, also can be used to make the point that things are not always as simple as they seem. In fact, this provides the lead-in to a section on genetics. After studying Mendelian genetics, students are asked to re-analyze their fly data to see whether there might be some alternative explanations for their results. For instance, could a crawler mate with a flier? If so, what would be the phenotype of their offspring?
Adaptation and Heritability
These concepts also appear on the students’ concept maps of Lamarck’s theory. The null hypotheses are that organisms will not exhibit adaptation to environmental perturbation and that even if adaptions are evident, they will not be heritable. Perhaps the most common misconception about the mechanism of evolution is that individually acquired adaptations can be passed on to offspring. Therefore, this investigation is critical in helping students to develop a more sophisticated understanding of natural selection.
Research teams are provided with seeds of Wisconsin Fast PlantsTM and asked to design an experiment to test the hypothesis concerning adaptation to the environment. Fast PlantsTM are a particularly useful organism for this study because of the variety of characters that can easily be quantified: for example, number and size of leaves, number and size of internodes, overall length, and a variety of anatomical surface features such as hairs and stomata that can be sampled non-destructively. In addition, a variety of environmental treatments can be employed without concern for pain to the organism. Plants show much greater developmental plasticity in response to environmental factors than do animals. Finally, the life cycle is rapid enough that the treated generation can produce seeds that can be grown out in a second generation to test for heritability.
We usually begin by listing on the board as many environmental parameters as possible that might affect plant growth. Research teams are then asked to choose one parameter and design an appropriate experiment to test for an adaptive response. Variables involving light and water are the most commonly chosen, including light intensity, light quality (color), light duration, quantity of water applied, and substances added to water. Each team must investigate a different parameter and all research plans must be approved before the investigation can begin.
One of the more interesting student-designed experiments investigated the effect of gravity on stem growth. In this investigation, Fast PlantsTM were grown in square styrofoam cubes that can easily be laid on their side; the experimental cubes were placed on their side as soon as plants germinated — a period of about 3 days. Every day thereafter, the cubes were rotated to the next side so that, at the end of a week, there was a full rotation. The plantlets developed with a “corkscrew” phenotype. The controls were grown in the upright position.
Table 2A
|
||||
| Treatment | Day 2 | Day 4 | Day 6 | Day 8 |
| Upright Plants | 0 | 0 | 0 | 0 |
| Plants Rotated on Side | 0 | 2 | 4 | 6 |
Table 2B
|
||||
| Treatment | Day 2 | Day 4 | Day 6 | Day 8 |
| Offspring of Upright | 0 | 0 | 0 | 0 |
| Offspring of Rotated | 0 | 0 | 0 | 0 |
Table 2. Summary student data of heritability of adaptation to an environmental factor |
||||
The results of this experiment are shown in Table 2. The number of leaves produced in a spiral gyre were counted as “spiral revolutions”. Under optimal conditions, approximately one leaf is produced per day and thus each new leaf produced when a plant is oriented horizontally will be in a spiral gyre. The null hypothesis — that there is no phenotypic effect from the changing orientation to the force of gravity — must be rejected because of the obvious response of the plant to its horizontal rotation.
This was a particularly interesting experiment because a complex phenotype was produced that mimics the growth pattern of certain horticultural varieties such as the corkscrew willow. However, this adaptation cannot be inherited. Seeds from the treated plants, when grown in “normal” position, retain the normal upright growth pattern. Individual adaptation to the environment is not natural selection! Individuals can alter their form or behavior, to a limited degree, in response to their environment, but they cannot change their inherited characteristics.
Assessment of Effectiveness
The assessment items used in this study are drawn from instruments used in previous work (Sundberg 1997; Sundberg and Dini 1993; Sundberg and others 1994; Sundberg and Moncada 1994). To standardize the results, only scores on identical items, specifically targeted to common and persistent misconceptions, are reported here. The Integrative/Investigative category represents 3 pooled sections; the Majors’ Investigative Lab/Traditional Lecture category represents 4 pooled sections; and all other categories represent pools of more than 10 sections. In the previous work cited above, majors’ pre-test scores tended to be slightly higher than those of non-majors, but these differences were not significant. This pattern continues to hold true.
There is a consistent tendency for investigative instruction, integrating lecture and laboratory, to be more successful in promoting student understanding of the nature of science and the theory of evolution than traditional lecture/laboratory or traditional lecture/investigative laboratory. Figure 3 illustrates scores on a content post-test given at the end of the semester. Pre-test scores were in the range of traditional lecture/laboratory post-test scores. Virtually no change was observed in these classes between pre-test and post-test scores. In all four categories examined, the highest scores were attained when student-active lecture and laboratory activities were integrated in their presentation. Similarly, scores for traditional lecture and laboratory were the lowest; there was not a consistent difference between majors and non-majors courses. Students in traditional lecture courses combined with investigative laboratories obtained intermediate scores, and again there was not a consistent difference between majors and non-majors. Although similar tendencies are clear with each concept, the only statistically significant gain over the traditional approach was found in the category of improving scientific literacy.
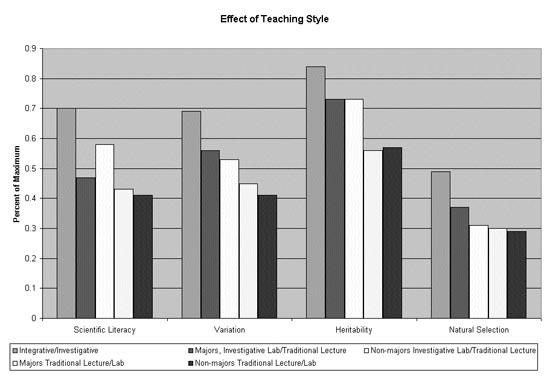 |
Figure 3. Impact of teaching style on student learning (percent correct on content post-test) in four concept areas: Scientific Literacy, Variation, Heritability, and Natural Selection. |
It is also clear from the data that some misconceptions are more ingrained than others. In particular, misconceptions concerning natural selection are particularly resistant to instructional intervention. Scores in this category were the lowest and showed the least change between pre-test and post-test scores. Scores in heritability, directly related to Mendelian genetics, consistently showed the greatest gains.
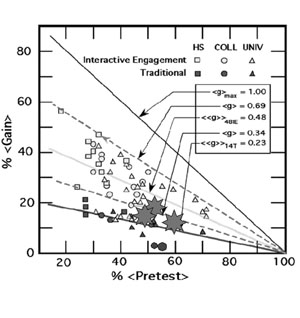 |
Figure 4. Data from current study superimposed on physics data reported by Hake (2002) demonstrating efficacy of "interactive engagement" over traditional lecture/laboratory. Three large "stars" represent experimental course from present study. Two large solid circles represent the TWO BEST sections of traditional control courses. |
The results of this study are comparable to similar results in physics, which demonstrate that students taught by interactive engagement consistently outperform students taught by traditional lecture and laboratory (Hake 2002). Hake’s report summarized results from 62 physics courses enrolling more than 6500 students and different grade levels and from around the country. I have plotted data from the present study on top of Hake’s physics data (Figure 4). The three large stars represent the interactive/investigative sections from the present study and the two large circles represent the two highest performing sections of traditional lecture/investigative laboratory from this study.
Conclusion
It is well recognized that students bring to class many misconceptions concerning the nature of science and the nature of evolution. These beliefs, which often seem common sense and are reinforced by the media, are particularly resistant to modification — regardless of the pedagogy employed. This study provides some evidence to support the claim that student-active learning, where students are actively engaged in problem-solving, is more effective than traditional instruction in overcoming this barrier. Although with only one exception the data reported are not statistically significant, the consistency of the trends suggest that the observed differences are due to more than sampling error or chance.