 One of the legacies of school science is an approach in which all possible variables in an experiment are reduced to the point that one mathematical expression can explain an outcome, and that that outcome can be generalized to a broader range of phenomena — a deduction. This was Einstein’s approach: absolute mathematical precision describing singular outcomes, but at the expense of lacking a complete description of the world outside of the experiment. This approach provides linear problem-solving and explanations — if X, then Y — that work well in simple systems, and predictions can be shown on a graph.
Much work in the Earth sciences, however, is focused on being complete, capturing as much of the variation present in the real world as possible, and inductively developing multiple working hypotheses, which must be tested against one another. A mountain can be understood as a pattern of interactions over time across a variety of forces, accepting that the system is complex and that a specific outcome cannot be predicted. Understanding the interactions allows one to describe patterns at different physical and time scales, accepting that there is no “prospect of an end,” as James Hutton put it, meaning that the goal is not a specific endpoint.
For as long as I can recall, the effects of increased CO2 in the atmosphere on global average temperatures have been represented by graphs showing a rapid increase in temperature over the last two centuries, sometimes embellished in red. Such graphs are easy to prepare, but they’re misleading. The general public assumption is that temperature change targets and limits, such as those presented in the Intergovernmental Panel on Climate Change (IPCC) reports, are the result of simple generalizations with singular endpoints, à la the reductionist approach of the physicists, rather than patterns that represent the interactions and feedback across variables, with the best possible but nevertheless incomplete mathematical description.
Humans are pattern-seeking creatures, looking for patterns as a form of cognitive shorthand. Thinking takes energy and work, and as Daniel Kahneman points out in Thinking Fast and Slow (2013), we have one thinking system that is always “on” and can make quick judgements and evaluations, and a second system on “standby,” which requires more effort for careful analysis, but generally yields more representative, heuristic outcomes. It is the biases inherent in the first system that, while providing basic survival value, can also drive us to erroneous conclusions by finding patterns where none exist or disregarding patterns that do exist. Activation of the second system requires a different approach, seeking not simple generalizations and singular endpoints, but rather the influences of different variables on dynamic and changing patterns. This approach is best supported by complex systems thinking.
A variety of resources are available on teaching and applying different aspects of systems thinking (e.g., Fichter et al. 2010; Rutherford 2019) that 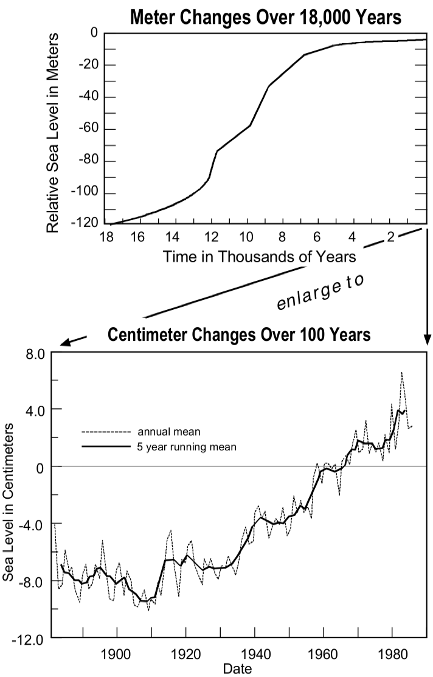 explore the nature of feedback loops, power-law relationships, and sensitive dependence on starting conditions. Of these elements, fractal patterns, those that look very similar at different scales, represent the source of graphical fascination for many audiences. A prime example is the Mandelbrot set, with its curved hooks on curved hooks, each shape similar down to amazingly small scales. Examining past climate data (see Figure 1, right, Fractal patterns in sea level change at different time and height scales. Courtesy of Lynn Fichter, James Madison University.), you can see the patterns within patterns over time, reflecting oscillations in average sea level, temperature, CO2, and so on. But when these patterns are compared to the most recent record, it becomes clear that recent climate change exhibits a different sort of pattern, one that is well off the charts. This shows the value of applying systems thinking when teaching climate change. Even the untrained eye seeks and finds patterns, and once a dialogue about the incongruent patterns has begun, the conversation can be guided with evidence.
Presenting the discussion in patterns and pictures also helps learners to replace models of the climate system based on supposition and, potentially, conspiracy theories with plausible (and scientifically accurate) models. Challenging erroneous beliefs can easily be seen as an attack on someone’s personal self-concept: if they are wrong about climate change, then they are defective in some way. To avoid that conclusion, people will make patterns up, short-circuiting the slower analytical thinking. Instead, you should approach a dialogue on climate change with respect: “I am not asking you to change your mind, but asking what would it take to change your mind?”: By removing self-concept from the discussion, a whole raft of biases are sidestepped. And by focusing on the patterns of the data, people are drawn to engage analytically rather than to challenge the evidence reactively.
The science curriculum needs to present not just a series of core ideas but also how those ideas are developed through scientific practices and how they are connected to other ideas. Systems, patterns, and scales are central to those crosscutting concepts, and teachers need professional learning experiences, reflective of the point in their career that they find themselves, to teach accordingly. Approaching the teaching of climate science and climate change with a systems approach will yield a more robust pattern of understanding, and serve as a basis for more sound decision-making.
References
Fichter, L. S., E. J. Pyle, and S.J. Whitmeyer. 2010. Strategies and rubrics for teaching chaos and complex systems theories as elaborating, self-organizing, and fractionating evolutionary systems. Journal of Geoscience Education 58 (2): 65–85.
Kahneman, D. 2013. Thinking Fast and Slow. New York: Farrar, Straus and Giroux.
Rutherford, A. 2019. The Elements of Thinking in Systems. Amazon Kindle Direct Publishing.
Read other essays from our #ClimateEdNow series.