COVID-19’s second wave?

What can the flu pandemic of 1918-1919 tell us about a possible second wave of COVID-19 infections? NCSE Director of Teacher Support Lin Andrews examines the record.

wave

Photo by 翔音 on Unsplash

Check out our entire series explaining the science involved in the coronavirus pandemic. Sign up to receive our coronavirus update each week.

Lately, you’ve probably been hearing a lot about a second wave of COVID-19 in the fall. You might be wondering, “When did the first wave end? Was I on vacation?”

The reality is the first wave hasn’t ended yet. We are still enduring the first wave and will be for some time to come. So why all the chatter about a second wave?

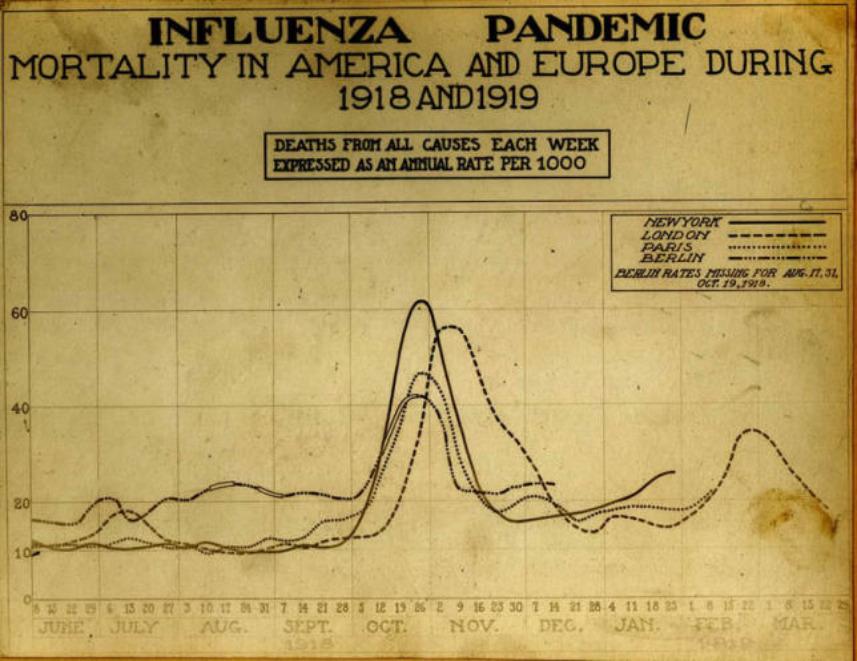
Well, since we have never seen anything like SARS-CoV-2 (the virus responsible for COVID-19) before, it’s tempting to look to past pandemics to predict the future. And the pandemic that seems the most relevant is the flu pandemic of 1918–19, sometimes inaccurately called the Spanish Flu. (Bonus question: Where did that name come from and why is it misleading?) Looking back on the spread of the flu in 1918, we see that there was a relatively small wave of flu in the spring of 1918, followed by a lull in the summer, followed by massive waves of the disease in the fall. It’s reasonable to wonder whether the same pattern could happen with COVID-19.

But let’s look more closely at the details. The spring wave of the 1918 influenza was not universal, few individual outbreaks spread to neighboring communities, and there were relatively few deaths. As you can see from the graph below, the spring wave barely registered as a blip of higher mortality in four major cities. In the fall, mortality rates tripled. When influenza broke out in a community in the fall of 1918, up to a third of the population would fall sick within just two weeks. Within a month, the flu would be gone, having killed 2 to 3 percent of those who fell ill. In many places, as in the case of London shown on the graph below, there was yet another wave of the virus in the spring of 1919.

1918-1919 flu mortality chart

If COVID-19 followed the same pattern, we could expect another, and much worse, wave of coronavirus in the fall with three times as many deaths as we’ve seen so far. It would be reasonable to consider panicking. But don’t panic yet. According to no less an authority than Anthony Fauci, a second wave is not inevitable. We need to compare the public reactions to the pandemics of 1918–19 and of 2020 before we accept that a giant second wave of COVID-19 is inescapable.

In the first, ongoing wave of coronavirus, social distancing measures have succeeded in saving millions of lives and flattening the curve. According to a recent article published in Nature, in six countries studied, including the United States, over 60 million COVID-19 infections were prevented thanks to shutdowns. Some countries, most successfully New Zealand, kept these controls in place until the virus was essentially eliminated, allowing the country to re-open completely. Importantly, these measures were more stringently formulated and more consistently applied than anything any city undertook in 1918.

But concerns in the US about the struggling economy have spurred many states to speed through the suggested phases of reopening. Along with a combination of the Memorial Day weekend celebrations and disregard of social distancing practices, this rapid reopening has led to an increase in new daily COVID-19 cases in over 20 states. An epidemiologist at Vanderbilt University Medical Center explained that what we are seeing in the US is a “constant chain of smaller spikes.” In other words, we are not looking at large, cresting waves like those seen during the 1918 flu pandemic, but rather an ongoing series of outbreaks in places where measures to curb the virus’s spread are relaxed or absent.

The question on our minds therefore shouldn’t be “Will there be a second wave?” but rather “What measures do we need to take to keep outbreaks local and manageable?”

And that means the eventual arrival—or not—of a second wave depends entirely on us. If you’d like to explore the possible scenarios, I suggest sharing these graphs, prepared by a statistician at the University of Strathclyde, with your students. The take-home message is that our behavior affects the coronavirus’s reproductive number R (average number of new cases caused by one infected individual), which in turn predicts whether outbreaks will grow exponentially into a huge wave, come and go in smaller waves, or fade out altogether.

The question on our minds therefore shouldn’t be “Will there be a second wave?” but rather “What measures do we need to take to keep outbreaks local and manageable?”

Maybe that’s not very satisfying. It doesn’t make good headlines and it sounds much less dramatic. But by working through scenarios about how our behavior affects R and how that plays out in terms of how fast the virus spreads, we can all begin to understand that catchphrases like “second wave” do not begin to capture the complexity of the situation. The term “second wave” misleadingly implies that we have successfully beaten COVID-19 once and that we may or may not have to try to do so again, but the reality is that we continue to fight local battles daily. How we approach that task will go a long way towards determining what happens in the coming months.

There is light at the end of the tunnel. We know how to contain the virus: masks, appropriate social distancing, avoidance of crowded indoor venues, and lots of testing followed by contact tracing. These practices, along with hand-washing and proper hygiene, are the only certainties we have. So, if you haven’t learned the words to “the hand-washing song” at this point, it might be time—we’re going to be singing it for a while.

NCSE Director of Teacher Support Lin Andrews
Short Bio

Lin Andrews is NCSE Director of Eduation.

andrews@ncse.ngo